
Un material realizat de președintele Autorității de Supraveghere Financiară (ASF), Alexandru Petrescu, împreună cu specialiștii ASF Marius Acatrinei și Silviu Nistor și transmis spre publicare către Journal of the Financial Supervisors Academy (JFSA).
Financial supervisory authorities increasingly recognise geopolitical instability as a structural driver of systemic risk. Yet existing surveillance frameworks lack real-time tools to detect contagion dynamics as they emerge. This article presents a practical early warning framework that combines nonlinear Granger-causal network analysis with spectral methods to monitor financial interconnectedness across European capital markets. Using kernel-based causality testing, we construct time-varying directed networks that capture predictive relationships between 26 European stock indices. The spectral radius, the dominant eigenvalue of the network adjacency matrix, serves as a scalar indicator of systemic fragility: values near unity indicate normal market segmentation, while sharp increases signal regime transitions toward contagion. Applied to the period 2019–2025, the framework identifies distinct transmission channels: geopolitical risk shocks trigger delayed network tightening (approximately 150 trading days), while trade and economic policy uncertainty operate through the expectation channel. These findings carry direct implications for macroprudential surveillance, stress testing calibration, and the operationalisation of early warning systems.
When Russia invaded Ukraine in February 2022, European supervisory authorities confronted a question their existing stress-testing models were ill-equipped to answer: how rapidly would financial contagion spread across European markets, and which nodes in the financial system would prove most vulnerable? The weeks that followed demonstrated how quickly geopolitical shocks can transform isolated market movements into system-wide fragility. Network density, the proportion of significant predictive relationships between markets, surged from baseline levels of approximately 2% to over 35%, representing a near-complete breakdown of market segmentation.
This episode was not isolated. The COVID-19 pandemic onset in early 2020 triggered an even more dramatic network tightening, while the escalation of Middle East tensions in late 2024 produced comparable contagion dynamics. These events underscore a fundamental challenge for financial supervisors: geopolitical instability has evolved from an occasional external shock into a persistent, structural driver of systemic risk.[1] Traditional macrofinancial models, built primarily on growth, inflation, and interest rate dynamics, struggle to capture the anticipatory, nonlinear, and cross-market transmission mechanisms through which political events reshape financial interconnectedness.
This article addresses this supervisory gap by presenting a practical framework for detecting financial contagion in real time. The approach integrates nonlinear Granger-causal network analysis with spectral methods to produce a single, interpretable indicator of systemic fragility: the spectral radius of the network adjacency matrix. Mathematically, the spectral radius λmax represents the largest eigenvalue of the adjacency matrix, a quantity that in network diffusion theory, governs the speed and persistence of shock propagation.[2] When this indicator rises sharply, it signals a regime transition from diversification to contagion, providing supervisors with an early warning signal and a window to implement precautionary measures.
The framework is applied to 26 European national stock market indices over the period 2019–2025, encompassing the COVID-19 crisis, the Russia-Ukraine war, ongoing US-China trade tensions, and multiple episodes of elevated policy uncertainty. Three categories of uncertainty are examined using the Caldara-Iacoviello indices: geopolitical risk (GPR), trade policy uncertainty (TPU), and economic policy uncertainty (EPU).[3] Each exhibits distinct transmission dynamics, with important implications for how supervisors should interpret and respond to different types of uncertainty shocks.
The article makes three principal contributions. First, it introduces a nonlinear Granger-causal network approach using kernel-based regression that captures predictive linkages between markets beyond what linear correlation methods detect. Second, it links these networks to spectral analysis by demonstrating that the dominant eigenvalue serves as an effective early warning indicator of systemic fragility. Third, it distinguishes between uncertainty types that require fundamentally different supervisory responses, a finding with direct operational relevance for macroprudential authorities.
The remainder of this article is organised as follows. Section 1 situates the framework within the broader supervisory context. Section 2 presents the methodological framework, including the technical foundations. Section 3 reports the empirical findings. Section 4 discusses implications for financial supervisory authorities. The article concludes with reflections on the trajectory of geopolitical risk in financial stability surveillance.
01. Geopolitical Risk and Financial Stability: The Supervisory Challenge
The recognition that geopolitical factors pose material risks to financial stability is not new. However, the period since 2020 has fundamentally altered the supervisory landscape. The European Central Bank’s Financial Stability Review identifies trade tensions, tariff shocks, cyber vulnerabilities, and supply chain fragmentation as central challenges for euro area markets.[4] Three key vulnerabilities are highlighted: elevated valuations and liquidity mismatches among non-bank financial intermediaries; credit risks to export-oriented industries exposed to geopolitical fragmentation and fiscal vulnerabilities arising from increased defence spending and weak growth prospects.
The transmission channels through which geopolitical shocks propagate have become increasingly complex. Research demonstrates that markets react rapidly to political events through both financial channels, investor sentiment, liquidity stress, and risk premia adjustments, and real-economy channels, including commodity price dislocations, supply chain disruptions, and inflation volatility.[5] Energy markets respond particularly sharply to geopolitical conflicts, with direct effects on inflation expectations, bond yields, and equity valuations.[6] During such episodes, capital typically reallocates toward traditional safe-haven assets, generating correlated movements that supervisory models must capture.
The network structure of financial markets has emerged as a critical determinant of contagion dynamics. Theoretical work by Acemoglu, Ozdaglar, and Tahbaz-Salehi demonstrates that network topology governs whether microeconomic shocks remain localised or cascade into systemic events.[7] Their framework shows that nonlinearity and heterogeneity in network interactions can generate phase transitions between stable and fragile regimes, insights that map closely onto financial contagion. Empirical studies using Granger-causal networks have documented rising interconnectedness across financial institutions prior to crises, establishing the predictive value of network-based indicators.[8] More recent contributions highlight how multilayer financial networks, incorporating both institutions and market infrastructures fundamentally alter vulnerability assessments.[9]
Despite these advances, a gap persists between academic network analysis and practical supervisory application. Existing approaches often require extensive computational resources, produce outputs difficult to interpret in real time, or fail to distinguish between different types of uncertainty shocks. Supervisors require tools that are transparent, computationally tractable, and capable of providing actionable signals within operational decision-making timeframes. The framework developed in this article responds to these requirements.
02. A Network-Based Framework for Contagion Detection
The methodological framework proceeds in three stages: (i) kernel-based causality testing identifies directional predictive relationships between markets; (ii) significant relationships are encoded into time-varying adjacency matrices estimated over rolling windows; (iii) spectral analysis of these matrices produces a scalar systemic risk indicator (the spectral radius) that captures the network’s amplification potential.
Nonlinear Granger Causality via Kernel Regression
Standard linear Granger causality tests whether past values of one variable improve predictions of another but assumes linear relationships. During stress periods, market dynamics depart substantially from linearity and threshold effects, asymmetric responses, and regime-dependent behaviour become prevalent. The framework addresses this limitation by employing the Nadaraya-Watson kernel estimator, which allows the data to reveal predictive relationships without imposing functional form assumptions.
For each pair of the 26 European indices, the method tests whether lagged returns of market i improve predictions of market j beyond what j‘s own history provides. The test statistic compares mean squared errors from restricted (own lags only) and unrestricted (own lags plus cross lags) models:
Sobs = MSErestricted − MSEunrestricted
A positive value indicates predictive improvement, suggesting i → j causality. The Gaussian kernel bandwidth is set to the median pairwise distance, a choice that adapts automatically to data dispersion and is robust to the extreme observations common in crisis periods. Statistical significance is assessed via permutation testing (B = 500 replications), with Benjamini-Hochberg false discovery rate correction (α = 0.05) applied to control for the 650 pairwise tests conducted at each window.
Time-Varying Directed Networks
Networks are estimated over 100-day rolling windows (step = 5 days), producing a sequence of directed adjacency matrices At. Edge weights are defined as Aij = 1 − pij for FDR-significant connections (zero otherwise), ensuring stronger causal links receive higher weights. Row i captures outgoing influence (transmitter); column j captures incoming influence (receiver). This directed structure distinguishes shock transmitters from receivers, a distinction critical for identifying systemically important markets.
Crucially, the network is constructed entirely from return data, independent of any uncertainty measure. This design choice ensures that comparisons between different uncertainty types are not confounded by construction artefacts. The uncertainty indices enter only at the analysis stage, when network properties are related to shock occurrences.
The Spectral Radius as Early Warning Indicator
The central output of the framework is the spectral radius: the largest eigenvalue of the adjacency matrix, denoted λmax(At) = max|eig(At)|. In network diffusion theory, the dominant eigenvalue governs the dynamics of shock propagation through a network.[10] Specifically, if we model shock transmission as a linear process where each node’s state depends on its neighbours’ previous states, the spectral radius determines whether perturbations amplify or decay over time.
When λmax < 1, shocks decay exponentially and the network is stable and diversification benefits remain intact. When λmax ≈ 1, the system is near a critical threshold. When λmax > 1, shocks can amplify as they propagate, potentially generating cascading failures. In our empirical application, λmax ranges from approximately 1 during tranquil periods to over 10 during crisis episodes, a tenfold increase that captures economically meaningful regime transitions.
Network density Dt provides a complementary measure, capturing the prevalence of significant predictive relationships without weighting by strength. Early warning signals are triggered when the
Z-score of Δλmax exceeds 2 or when density surpasses its 90th percentile.
The framework possesses three properties essential for supervisory application. Nonlinearity: kernel regression captures complex dependencies that linear methods miss, particularly during crisis periods when market dynamics depart from normality. Directionality: the Granger-causal structure distinguishes shock transmitters from receivers, enabling identification of systemically important markets. Aggregation: spectral analysis compresses 650 pairwise relationships into a single scalar indicator, facilitating real-time monitoring while preserving the network’s global amplification properties.
03. Evidence from European Markets (2019–2025)
The framework is applied to daily returns of 26 European stock market indices spanning January 2019 to October 2025. Geopolitical shocks are defined as 99th-percentile exceedances of each uncertainty index, applied separately to Geopolitical Risk, Trade Policy Uncertainty and Economic Policy Uncertainty to isolate distinct transmission channels. The shock-network relationship is assessed through: (i) two-sample t-tests comparing density in shock versus non-shock windows; (ii) cross-correlation analysis to identify optimal lead-lag structure; (iii) event studies tracking average density trajectories around shock dates; and (iv) predictive regressions of density changes on lagged shock indicators.
Regime Transitions in Network Connectivity
Figure 1 displays the evolution of the spectral radius and network density over the sample period. Both indicators exhibit pronounced regime-switching behaviour, with two dominant spikes corresponding to periods of extreme systemic fragility.
FIGURE 1: Spectral radius (λmax) and network density time series]
Source: Author’s own calculations
The COVID-19 pandemic onset (early 2020) produced the highest spectral radius in the sample, reaching approximately 10.5. Network density simultaneously peaked at around 37%, indicating that more than one-third of all possible directed causal links became statistically significant. This represents a near-complete breakdown of market segmentation, where predictive relationships propagated across virtually all market pairs simultaneously.
The Middle East escalation (late 2024–early 2025) generated a second major spike, with the spectral radius approaching 10 and density reaching 33%. During tranquil periods (notably 2023 through mid-2024), the spectral radius remained close to unity and network density hovered around 2%, baseline conditions reflecting normal market functioning where diversification benefits remain intact.
The red dashed line in the density panel (approximately 0.1) represents the 90th percentile threshold; exceedances trigger early warning signals. The black dashed line in the spectral radius panel shows the sample mean (approximately 1). Deviations above this mean, particularly when standardised Z-scores exceed 2, flag potential contagion onset.
Geopolitical Risk: Delayed but Persistent Transmission
Geopolitical risk shocks, GPR index realisations exceeding the 99th percentile, are associated with statistically significant increases in network interconnectedness. The two-sample t-test yields p = 0.042, confirming that windows containing GPR shocks exhibit significantly higher network density than non-shock windows.
FIGURE 2: Geopolitical shock (GPR)
Source: Author’s own calculations
The cross-correlation function reveals that the peak correlation of approximately 0.22 occurs at lag +30 windows (approximately 150 trading days). This positive lag indicates that network tightening follows GPR shocks rather than preceding them. The temporal ordering reflects the inherently unanticipated nature of geopolitical events: military conflicts, political crises, and acts of terrorism cannot be positioned in advance. When such shocks materialise, they gradually erode market segmentation as investors reassess cross-market dependencies and new predictive relationships establish themselves.
The event study tracks average network density in a window spanning 10 periods before to 20 periods after GPR shock events (N=18 shock events identified at the 99th percentile threshold). The baseline density (green dashed line) sits at approximately 0.02, representing the pre-shock average. Following the shock (vertical red dashed line at window 0), density exhibits a gradual upward trajectory, rising to approximately 0.04–0.06 in the post-shock windows. The shaded region represents the 95% confidence interval, which is relatively wide due to heterogeneity across the 18 shock events. Notably, the density does not spike immediately at the shock date but rather builds progressively in the 5–15 windows following the shock. This delayed response is consistent with the cross-correlation evidence and suggests that geopolitical uncertainty takes time to translate into tighter predictive coupling across markets. The density response to GPR shocks is gradual and cumulative, not instantaneous.
For supervisors, this implies a two-stage early warning structure. The initial signal (density beginning to rise) builds progressively over 5–15 windows (approximately 1–3.5 months) following a geopolitical shock. The full systemic impact (maximum network coupling) happens at a lag of approximately 30 windows (7 months). This extended adjustment period provides time to enhance liquidity monitoring, activate contingency protocols, or adjust capital buffer expectations.
The histogram compares network density distributions between shock windows (red) and non-shock windows (gray). The two-sample t-test yields p = 0.0419, indicating a statistically significant difference at the 5% level. Both distributions are right-skewed with most mass concentrated near zero, reflecting the generally sparse nature of the Granger-causal network. However, the shock distribution exhibits a heavier right tail, with more frequent observations in the 0.05–0.35 range. This confirms that windows containing GPR shocks are associated with significantly higher network connectivity—approximately 2.5 times the baseline level on average. The statistical significance of the t-test (p = 0.0419) and the cross-correlation pattern both support the conclusion that the GPR-network relationship is not spurious. However, the wide confidence intervals in the event study and the insignificant individual lag coefficients suggest considerable heterogeneity across shock events meaning that some GPR shocks may trigger strong network responses while others have more muted effects.
Trade and Economic Policy Uncertainty: Anticipation Effects
Trade policy uncertainty and economic policy uncertainty exhibit fundamentally different transmission dynamics compared to GPR.
FIGURE 3: Trade Policy Uncertainty shock (TPU)
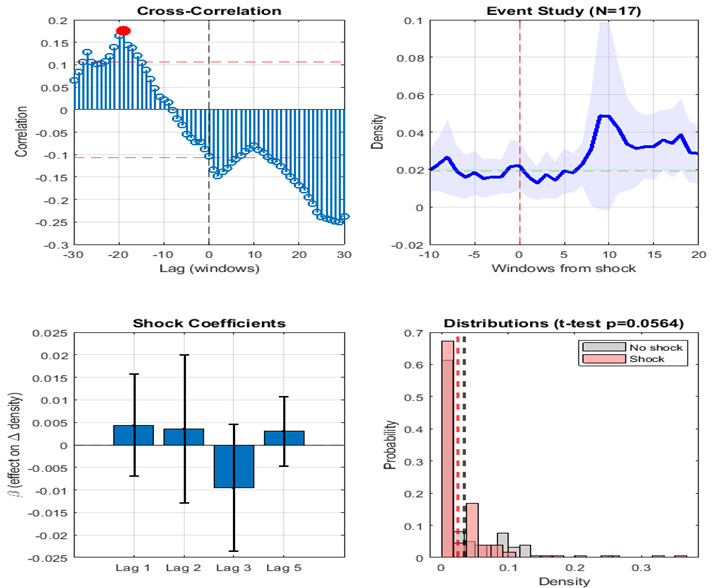
Source: Author’s own calculations
For TPU, the cross-correlation function peaks at lag −22 windows (approximately 110 trading days before the shock). For EPU, the peak occurs at lag −20 windows (approximately 100 trading days before). These negative lags indicate that network density rises before the uncertainty indices register extreme values which is the opposite pattern from GPR.
The t-test yields p = 0.0564, marginally insignificant at the 5% level but significant at the 10% level. The distributions show that shock windows have slightly higher mean density (approximately 0.03) compared to non-shock windows (approximately 0.02). While the separation is weaker than for GPR, this is again consistent with the expectations channel: if we define “shock windows” based on when TPU formally spikes, we are capturing the end of the market adjustment process rather than its peak
This pattern reflects an expectations channel. Trade negotiations unfold over months with extensive media coverage, political statements, and preliminary announcements. Economic policy changes such as fiscal stimulus, monetary policy shifts, regulatory reform are debated publicly in legislatures and previewed through central bank forward guidance. Forward-looking markets incorporate these anticipated developments before they formally materialise in uncertainty indices, tightening their
cross-dependencies during the anticipation phase.
FIGURE 4: Economic Policy Uncertainty (EPU)
Source: Author’s own calculations
The EPU event study provides particularly clear visual evidence: network density rises substantially in the windows before the formal shock date, reaching approximately 0.04–0.05 around windows −5 to −3. At window 0, density has already begun to decline from its pre-shock peak. This pattern tells a coherent story: markets tighten their predictive dependencies in anticipation of economic policy uncertainty, reaching maximum interconnectedness just before the shock formally materialises. Once the policy is announced or implemented, uncertainty is resolved and markets de-couple.
This pattern tells a coherent story: markets tighten their predictive dependencies in anticipation of economic policy uncertainty, reaching maximum interconnectedness just before the shock formally materializes. Once the policy is announced or implemented, uncertainty is resolved and markets de-couple.
The regression coefficients for lagged EPU shocks predicting Δdensity have confidence intervals that cross zero, indicating no statistically significant short-term predictive power. The alternating signs suggest no systematic relationship between lagged shocks and density changes.
This null result is fully consistent with the expectations channel interpretation. By the time the EPU shock formally occurs, the market adjustment has already happened. Lagged shocks cannot predict density changes because the network response occurred during the anticipation phase, not after the shock date.
The t-test yields p = 0.3767, which is clearly not statistically significant. This result is again consistent with the expectations channel. Our methodology classifies windows based on when EPU formally crosses the 99th percentile threshold. But if the market response occurs before this threshold is crossed, then “shock windows” do not capture the period of elevated interconnectedness.
Supporting evidence comes from high-frequency maritime indicators such as PortWatch data, which document pre-sanction frontloading behaviour, economic agents adjusting their activities nonlinearly before political decisions are formally enacted.[11]
The supervisory implication is significant: for policy-related uncertainty, network-based indicators can serve as leading rather than lagging signals. Elevated network connectivity may indicate that markets are pricing in anticipated policy changes before those changes are reflected in headline uncertainty indices.
04. Implications for Financial Supervisory Authorities
The empirical findings carry direct implications for macroprudential surveillance, stress testing, and the design of early warning systems. This section translates the analytical results into operational recommendations.
Operationalising Real-Time Monitoring
The spectral radius provides a single, interpretable metric suitable for inclusion in supervisory dashboards. Its properties align well with operational requirements:
- Interpretability. Values of λmax near 1 indicate normal market functioning; values approaching or exceeding 10 indicate crisis-level interconnectedness. The COVID-19 peak (10.5) and Middle East escalation (10.0) provide empirical benchmarks for calibrating alert thresholds.
- Timeliness. The indicator can be updated on a rolling basis as new return data become available.
- Complementarity. The spectral radius captures network-level fragility that correlation-based measures may miss. It complements rather than replaces existing systemic risk indicators such as CoVaR, SRISK, or composite stress indices.[12] Supervisory authorities could establish a tiered alert system: (i) enhanced monitoring when λmax exceeds its historical mean by one standard deviation; (ii) elevated surveillance when it exceeds two standard deviations or network density crosses the 90th percentile; (iii) crisis protocols when the spectral radius approaches historical crisis peaks (λmax > 8).
Incorporating Geopolitical Scenarios into Stress Testing
Current stress testing frameworks—including those administered by the EBA and national supervisory authorities—increasingly incorporate geopolitical scenarios.[13] The network-based framework provides empirical grounding for such scenarios:
- Calibrating correlation assumptions. Stress tests typically assume elevated correlations during adverse scenarios. The finding that network density can rise from 2% to over 35% provides empirical calibration for the magnitude of correlation breakdown during severe geopolitical stress.
- Distinguishing shock types. Different geopolitical scenarios warrant different temporal assumptions. Military conflict scenarios should incorporate lagged network response (5–7 month horizon), while trade policy scenarios should account for anticipatory market adjustment that may precede the formal policy shock.
- Identifying transmission nodes. The directed nature of the Granger-causal network identifies which markets serve as shock transmitters versus receivers during crisis episodes, information relevant for assessing concentrated exposures and cross-border spillovers.
Alignment with Regulatory Frameworks
The framework aligns with several ongoing regulatory initiatives:
- Digital Operational Resilience Act (DORA). DORA requires financial entities to identify and monitor ICT-related risks and their potential for systemic propagation. Network-based contagion monitoring provides a quantitative complement to qualitative resilience assessments, particularly for assessing how operational disruptions might cascade across interconnected institutions.
- ESRB systemic risk monitoring. The European Systemic Risk Board’s surveillance mandate encompasses cross-border spillovers and network interdependencies. The spectral radius offers a tractable summary measure consistent with ESRB’s analytical approach to macroprudential oversight.
- ESMA market surveillance. ESMA’s Trends, Risks and Vulnerabilities reports increasingly emphasise geopolitical risk channels. The distinction between GPR, TPU, and EPU transmission mechanisms provides analytical structure for these assessments.
Conclusion
The period 2019–2025 has demonstrated that geopolitical instability is no longer an occasional external disturbance but a structural component of financial risk. The COVID-19 pandemic, the Russia-Ukraine war, US-China trade tensions, and Middle East escalation have each generated distinct contagion dynamics that traditional macrofinancial models struggle to capture. As financial systems become more digitised, globally integrated, and exposed to operational risks, geopolitical shocks propagate faster and more unpredictably through asset prices and systemic structures.
This article has presented a practical framework for detecting and monitoring such contagion dynamics. By combining nonlinear Granger-causal network analysis with spectral methods, the approach produces a single, interpretable indicator—the spectral radius λmax—that summarises systemic fragility in real time. The spectral radius exhibits pronounced regime-switching behaviour: values near unity during tranquil periods, rising by an order of magnitude (to approximately 10) during crisis episodes such as COVID-19 and the Middle East escalation.
The framework distinguishes between uncertainty types with different transmission mechanisms. Geopolitical risk shocks—military conflicts, political crises—trigger delayed but persistent network tightening, with peak effects approximately 150 trading days after the shock. This lagged response provides supervisors with a meaningful early warning window. In contrast, trade and economic policy uncertainty operate through anticipation effects: network connectivity rises before formal uncertainty spikes as forward-looking markets price in expected policy changes.
For financial supervisory authorities, these findings underscore the need to augment existing surveillance frameworks with network-based monitoring tools. The spectral radius provides an early warning signal that complements correlation-based measures, while the distinction between shock types informs differentiated supervisory responses. Integration with stress testing frameworks, alignment with DORA requirements, and international coordination represent natural extensions of this work.
Looking ahead, the trajectory of geopolitical risk points toward continued relevance of such tools. Trade fragmentation, technological decoupling, cyber threats, and climate-related geopolitical tensions are likely to generate recurring episodes of elevated uncertainty. Supervisory authorities equipped with real-time contagion monitoring capabilities will be better positioned to navigate this increasingly complex risk environment.
Given the cross-border nature of geopolitical shocks, network-based indicators are most valuable when shared across supervisory authorities. Harmonised methodologies would facilitate consistent interpretation and coordinated response across jurisdictions.
[1] World Economic Forum, The Global Risks Report 2025 (20th edn, WEF 2025)
[2] D.Acemoglu, A Ozdaglar and A Tahbaz-Salehi, ‘Networks, Shocks, and Systemic Risk’ (NBER Working Paper No 20931, 2015)
[3] Caldara and M Iacoviello, ‘Measuring Geopolitical Risk’ (2022) 112 American Economic Review 1186
[4] European Central Bank, Financial Stability Review (May 2025).
[5] M.Hodula, M Melecky and M Urban, Geopolitical Risks and Financial Markets (Czech National Bank 2024).
[6] L Kilian, M Plante and AW Richter, Geopolitical Tensions and the Energy Market Response (Dallas Fed Working Paper 2024).
[7] D Acemoglu, A Ozdaglar and A Tahbaz-Salehi, ‘Networks, Shocks, and Systemic Risk’ (NBER Working Paper No 20931, 2015)
[8] M Billio and others, ‘Econometric Measures of Systemic Risk in the Finance and Insurance Sectors’ (2012) 104 Journal of Financial Economics
[9] RJ Berndsen, C León and L Renneboog, ‘Financial Stability in Networks of Financial Institutions and Market Infrastructures’ (2023) 35 Journal of Financial Stability
[10] JC Hua and others, ‘Using Dynamic Mode Decomposition to Extract Cyclic Behavior in the Stock Market’ (2020) 448 Physica A: Statistical Mechanics and Its Applications
[11] https://portwatch.imf.org/
[12] V Acharya and others, ‘Measuring Systemic Risk’ (2017) 30 Review of Financial Studies
[13] M Behn, JH Lang and A Reghezza, ‘Geopolitical Risk and Macroprudential Supervision’ (2025) 28 ECB Macroprudential Bulletin.
Alexandru Petrescu currently serves as President of the Financial Supervisory Authority of Romania (A.S.F.), a position he assumed in December 2023 following his appointment by the Romanian Parliament. In this role, he also represents A.S.F. as a member of the Boards of Supervisors of the European Insurance and Occupational Pensions Authority (EIOPA) and the European Securities and Markets Authority (ESMA). Previously, he was a member of the Romanian Government, holding successive portfolios as Minister of Economy, Minister for Business Environment, Trade and Entrepreneurship, and Minister of Communications and Information Society. During his last ministerial mandate, he coordinated the European Digital Single Market agenda as President of the Transport, Telecommunications and Energy (TTE) Council during Romania’s Presidency of the Council of the European Union. He holds a UK BSc in Business Administration and has extensive senior executive experience in banking and financial services across the UK, Denmark, and Romania, including investment banking, payments, cybersecurity, and complex ICT infrastructures.
Marius Acatrinei is Head of Financial Stability Unit at the Financial Supervisory Authority of Romania, where he conducts econometric research on financial stability and systemic risk. He holds PhD degree from Romanian Academy. His research focuses on network-based approaches to financial contagion and the application of quantitative methods to macroprudential surveillance.
Silviu Nistor is a Senior Expert at the Financial Supervisory Authority of Romania. In his current role, he monitors market developments, assesses financial stability, and identifies systemic risks in the non-bank financial sector. He holds a BA in International Relations and European Studies and an MSc in Business Intelligence. His research interests include financial stability, fintech regulation and the geopolitical drivers shaping global financial systems.


Leave feedback about this